
What is Micrometer?
Micrometer is a simple facade for collecting metrics inside Java applications in a vendor neutral way. You can think of SLF4J for metrics. Micrometer has built-in support for many different metrics backends, including Atlas, Datadog, Elastic, JMX and much more. In this post we will see how we can collect metrics with Micrometer in Java applications.
Micrometer dependencies
First we need to add the micrometer dependency to our project. Note that you need to choose the correct dependency based on the metrics backend you want to use.
Here we choose JMX, so we need the micrometer-registry-jmx artifact.
<dependency>
    <groupId>io.micrometer</groupId>
    <artifactId>micrometer-registry-jmx</artifactId>
    <version>1.2.0</version>
</dependency>
For example: If you want to use Elasticsearch instead of JMX, you need to add micrometer-registry-elastic.
Creating a MeterRegistry
Before we can start collecting metrics we need to create a MeterRegistry. The MeterRegistry is used to create Meters which then collect the actual metrics.
MeterRegistry is an interface with different implementations, based on the metrics backend you want to use. The simplest MeterRegistry implementation is SimpleMeterRegistry that does not export the data anywhere. It simply holds the latest value of each meter in memory.
MeterRegistry registry = new SimpleMeterRegistry();
If we instead want to export metric data to JMX, we need to create a JmxMeterRegistry.
MeterRegistry registry = new JmxMeterRegistry(new JmxConfig() {
    @Override
    public String get(String s) {
        return null;
    }
}, Clock.SYSTEM);
The get() method of the passed JmxConfig instance can be used to provide additional configuration values. We do not need this feature in our simple example, so we simply return null.
If we want to export our metrics to multiple monitoring backends, we can use a CompositeMeterRegistry. A CompositeMeterRegistry passes the data to one or more other registries, allowing you to publish metrics to more than one metrics backend.
For example:
CompositeMeterRegistry registry = new CompositeMeterRegistry();
registry.add(new JmxMeterRegistry(..));
registry.add(new ElasticMeterRegistry(..));
Meters
Meter is the micrometer interface for collecting metrics. Example implementations of Meter are Counter, Timer and Gauge.
Creating a Counter
We can create a Counter using a simple builder API:
Counter counter = Counter
        .builder("my.counter")
        .description("counts something important")
        .tag("environment", "test")
        .tag("region", "us-east")
        .register(registry);
This creates a Counter named my.counter and adds it to the MeterRegistry named registry. We can also add one or more tags and an optional description to our Counter. Meters are typically created once and then used multiple times.
To increase the counter value we can call the increment() method:
counter.increment(); // increment by one
counter.increment(2.5);
Creating a Timer
A Timer can be created in a similar way:
Timer timer = Timer.builder("my.timer").register(registry);
Here we skipped the optional parameters like tags or description.
We can now add timing metrics to our timer using the record() method:
// recording execution time of code
timer.record(() -> {
    // do something
});

// record a precomputed value
timer.record(Duration.ofMillis(123));
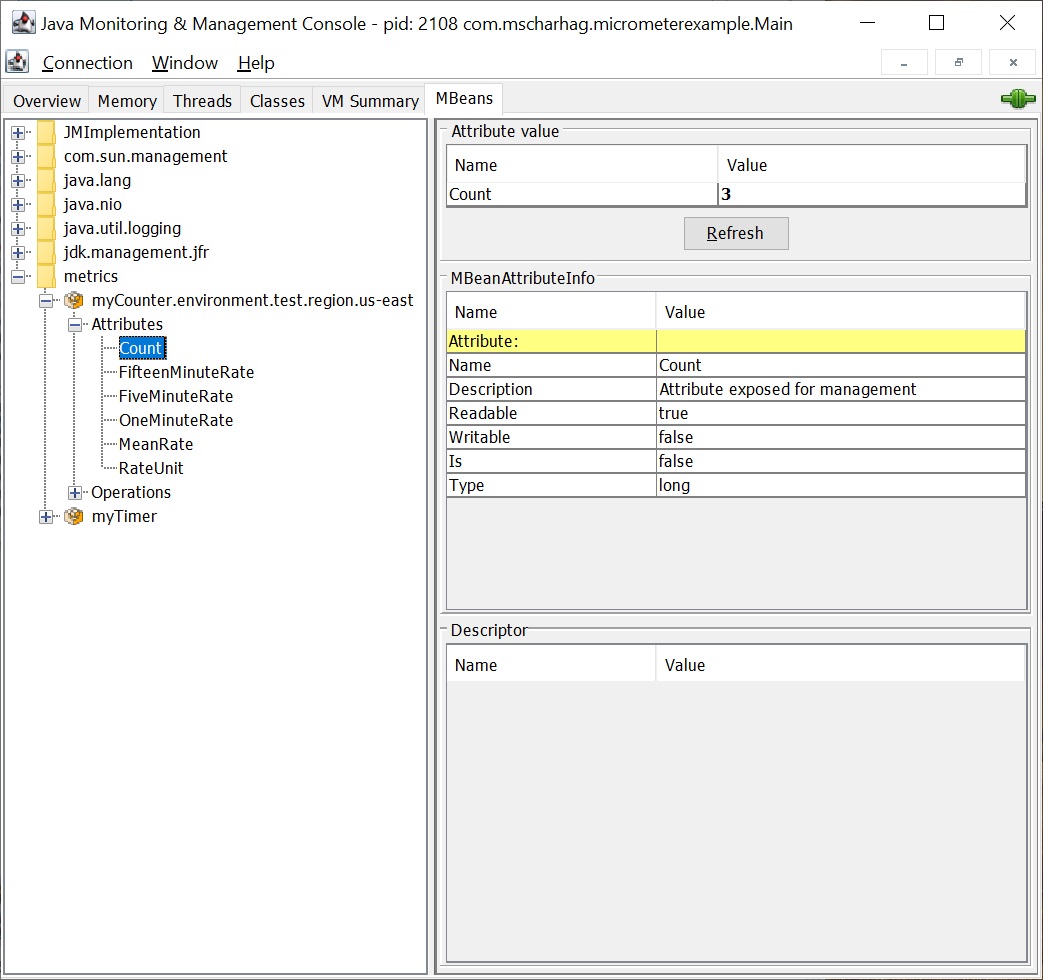
Viewing Results in JConsole
Since we are using a JmxMeterRegistry our metric information can be accessed via JMX. For this we can use JConsole which can be started by executing jconsole in your <jdk>/bin directory. After connecting to your Java application process you can find the current application metrics within the MBeans tab:
Of course you have to use a different tool to view the metrics if you use a different MetricsRegistry. For example you can use Kibana if you are using an ElasticMeterRegistry.
Summary
Micrometer provides an easy to use facade that can be used in Java applications for collecting application metrics. These metric information can be then exported to many different backend technologies (including Elasticsearch and JMX). You can find the source code for the examples on GitHub.
Leave a reply